
Economic Impact of HLVd on Cannabis Revenue
Most growers who lose money to HLVd never know it. The loss
registers as a disappointing harvest — lighter buds, lower
cannabinoid tests, a batch that went to extraction instead of
premium flower. The connection to an active viroid infection is
rarely made unless proactive testing is already in place.
Core Finding
57% - 98% revenue destroyed per harvest
Not because of biomass loss alone — but because potency collapse pulls infected product out of the premium pricing tier entirely.
How the Model Was Built
The model is based on a 100 lb (45,360g) dry flower harvest baseline — large enough to reflect real commercial economics, small enough to scale linearly for any facility size. Economic analysis developed by Anna Schwabe, PhD, from published literature on HLVd (Punja et al. 2024) and retail market pricing data.
Biological Impact Inputs — 3 Severity Levels
— Moderate HLVd: 30% yield reduction · 50% THC reduction
— Severe HLVd: 50% yield reduction · 60% THC reduction
— Worst Case: 70% yield reduction · 70% THC reduction
Pricing Tier Inputs — 3 Severity Levels
— Low Tier — $7/g: Commodity / extraction-adjacent market
— Mid Tier — $12/g: Mid-market premium flower
— High Tier — $20/g: Craft / top-shelf flower
Price per gram is not constant across infection levels. A cultivar that normally tests at 28–30% THC and sells at $20/gram does not sell for $12 or $14 when HLVd drops it to 14%. It exits the premium category entirely and moves to extraction pricing — $3–5/gram in most markets. The revenue loss is not proportional to yield loss. It is multiplicative.
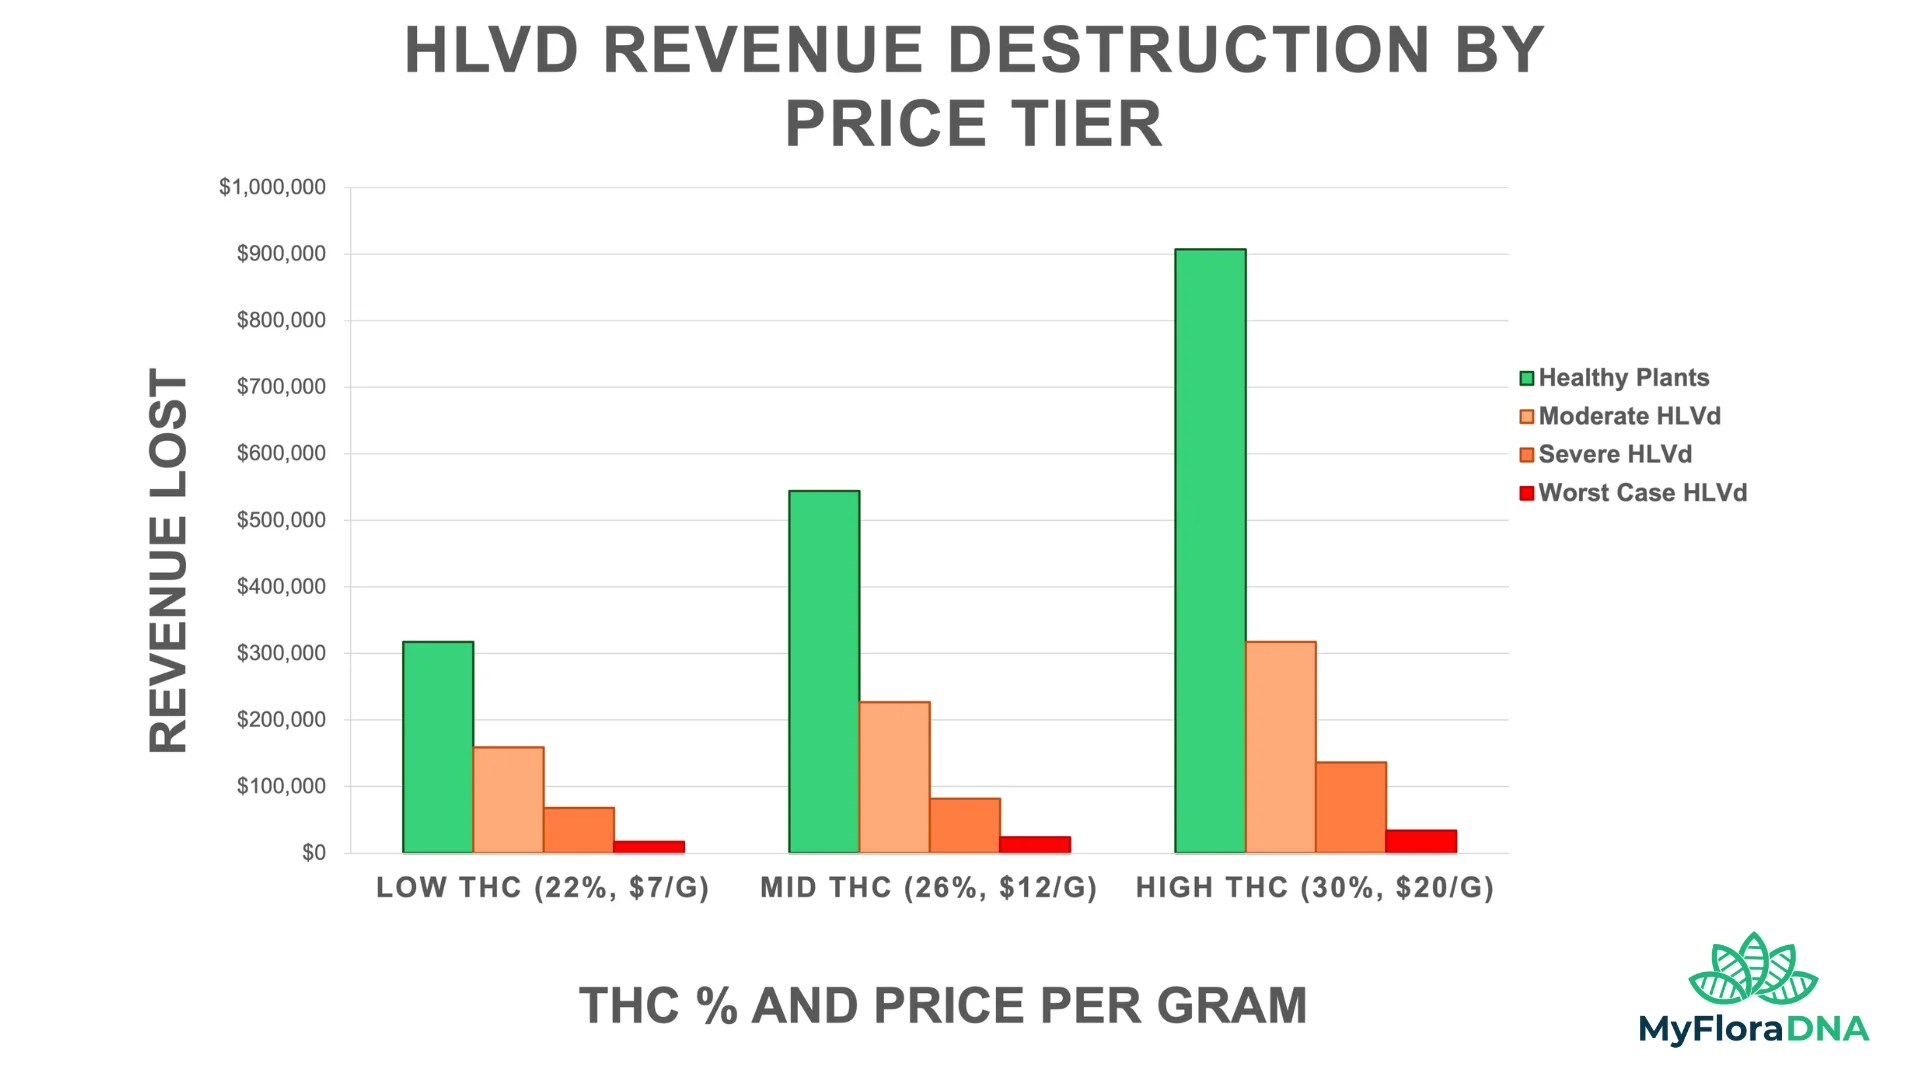
Full Revenue Loss by Severity
Healthy baseline: $317,520 – $907,200 depending on market tier. Every infected scenario falls dramatically below this baseline, with losses accelerating as infection severity increases.
| Scenario | Low Tier ($7/g) | Mid Tier ($12/g) | High Tier ($20/g) |
|---|---|---|---|
| Healthy Crop | $317,520 | $544,320 | $907,200 |
| Moderate HLVd | $136,800 -57% | $226,800 -58% | $135,720 -85% |
| Severe HLVd | $68,040 -79% | $81,648 -85% | $71,280 -92% |
| Worst Case | $17,010 -94% | $23,814 -96% | $20,340 -98% |
Source: Schwabe, PhD (2026). Yield loss and THC reduction based on published field data (Adkar-Purushothama et al. 2023, Punja et al. 2024). Actual results vary by cultivar, facility, and market conditions.
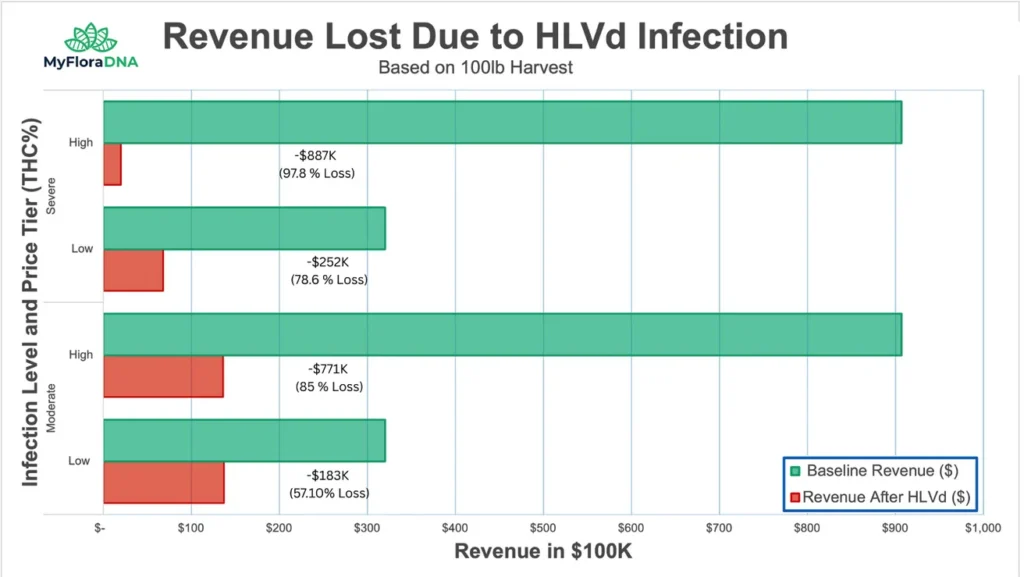
At the high market tier ($20/g), moderate HLVd produces 85% revenue loss — not 30%, which is the yield loss. The additional 55 percentage points come entirely from the pricing tier collapse. This is the number that changes how growers think about testing costs.
The Pricing Tier Collapse
Cannabis revenue is not linear with yield or potency. It is tiered. Premium flower commands $15–25/gram. Mid-tier flower commands $8–14. Extraction-grade or commodity flower commands $3–6. These are not slight gradations — they are discontinuous price breaks, and crossing one changes the economics of a batch completely.
When HLVd suppresses secondary metabolite production by 50–70%, the product no longer meets the specifications that define the premium tier. The result is not a proportional price reduction — the batch moves to the next tier down, or out of premium flower entirely into extraction.
$15-25/g
Premium / Top-shelf
25%+ THC · full terpene profile · dense bud structure
$8-14/g
Mid-tier flower
Mid-range potency · reduced terpenes · looser structure
$3-6/g
Extraction / Commodity
Below threshold for premium flower — extraction only
What drives the collapse
THC drops below top-shelf threshold
Most premium markets require 25%+ THC. HLVd suppresses cannabinoid biosynthesis by 50–70%, pulling even high- performing cultivars below the qualifying threshold.
Terpene content falls
Reduced aroma and flavor complexity removes the sensory qualities that premium buyers pay for. No terpene profile means no premium justification.
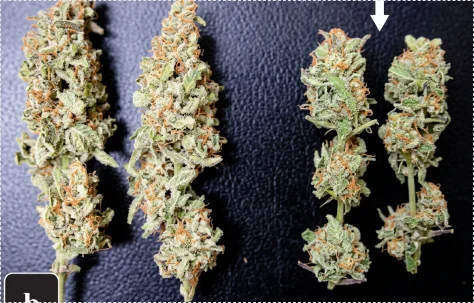
Bud structure loosens
Disrupted cell division produces loose, underdeveloped flower with reduced visual appeal and lower bag weight density — the visible signal buyers use to grade product.
One infected mother · two cycles · entire facility exposed
A single infected mother plant that goes undetected for two propagation cycles — roughly 6 months — distributes infected cuttings to every room it supplies. At 4–5 harvests per year, the infected genetics may have completed two full cycles before the financial signal registers. Every harvest in those cycles runs at 57–98% revenue loss.
$1.2M - $3.8M in Annual Revenue Destruction
Commercial cannabis operations run 4–5 harvest cycles per year. The per-harvest figures multiplied across a full year of production reframe the cost of testing entirely.
| Infection level | Harvests/Yr | Low ($7/g) | Mid ($12/g) | High ($20/g) |
|---|---|---|---|---|
| Moderate HLVd | 4 | $727,680 | $1,245,600 | $3,085,920 |
| Severe HLVd | 4 | $998,640 | $1,849,488 | $3,357,168 |
| Worst Case | 4 | $1,202,040 | $2,082,024 | $3,547,440 |
Annual loss = per-harvest loss × harvests/year. Based on 100 lb baseline. Scale linearly for facility size.
A MyFloraDNA multiplex qPCR panel costs $18 per sample.
One positive result that triggers quarantine before a contaminated mother room distributes infected cuttings pays for years of routine testing. The break-even calculation is not complicated.
$1.2M+
Min. annualized loss — moderate HLVd, mid tier, 4 harvests
$3.8M+
Max. annualized loss — moderate HLVd, high tier, 5 harvests
57-98%
Revenue lost across all severity and tier scenarios
$18
Cost per sample — MyFloraDNA multiplex qPCR panel
At mid-to-high tiers with 4–5 harvests annually, undetected moderate HLVd infection produces $1.2M–$3.8M in annualized revenue destruction from a pathogen that produces no dramatic visible symptoms and no alarm before the financial damage is done.
What the Model Doesn't Capture
The scenario table presents a conservative estimate of direct revenue loss. Several additional cost categories are real in practice
but not included in the model.
Remediation costs
Removal and destruction of infected plant material, deep sanitation of the facility, equipment replacement — none of which appears in a revenue loss calculation.
Genetic loss
If a high-value proprietary cultivar is infected and no clean stock exists, the genetics may be effectively lost without tissue culture recovery. No dollar figure captures that.
Customer relationship damage
Wholesale buyers who receive consistently underperforming product stop buying. That revenue loss extends beyond the infected batches themselves into long-term account erosion.
Regulatory and certification consequences
Operations pursuing clean stock certification or operating under state inspection programs face additional exposure if HLVd is discovered during compliance review.
The revenue loss figures in this model represent the floor of financial exposure, not the ceiling. For the biology that drives these numbers, see HLVd in Cannabis: Biology,
Spread, and Detection. For the testing strategy that catches HLVd before it reaches this point, see the HLVd cannabis testing pillar page.
Know your pathogen status before it shows up in your harvest data
Submit a sample and get quantitative results via MyFloraCLOUD in 72 hours or less.
Frequently Asked Questions
Because cannabis is priced by quality tier, not by weight. A 30% yield loss alone would produce roughly 30% revenue loss. But when HLVd also drops THC by 50%, the product moves out of the premium pricing tier into a lower category — often at a third of the original price per gram. The tier collapse multiplies the yield loss into total revenue destruction.
The yield and potency reduction figures are documented specifically for THC-dominant cannabis. The pricing tier collapse mechanism applies to any crop where product is graded and priced by quality specifications — including high-CBD cultivars and any crop where potency or terpene content determines market value.
A MyFloraDNA multiplex panel costs $18 per sample, although multiple plants in a harvest batch should be tested. A single harvest at moderate HLVd severity on a 100 lb high-tier crop loses over $771,000. The cost-benefit calculation resolves quickly. The more relevant question is how to structure a testing protocol that catches infection at the earliest possible point.
Yes, but the recovery path requires removing all infected material, sourcing or recovering clean genetics through tissue culture, and restarting propagation from verified clean stock. The faster the infection is caught, the fewer harvest cycles are compromised. Every cycle that passes undetected extends the financial damage.
The biological impact in yield and potency reduction is consistent across regions. The revenue impact scales with local market pricing. Operations in lower-price markets experience lower absolute dollar losses but the same percentage destruction. Operations in premium markets with high per-gram prices face correspondingly larger absolute losses.
Resources
Related Guides
Diagnostics, biosecurity, and remediation guidance